4 minutes estimated reading time
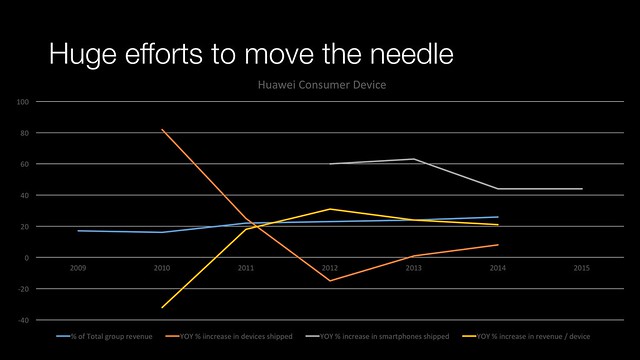
It is hard for anyone reading the media to believe that Huawei’s rise in the smartphone market was anything short of miraculous. In reality the roots of this rise go back at least six years. Back in 2010, Huawei was already shipping 3,000,000 smartphones. However since that time, the year-on-year percentage growth in consumer devices shipped by the company reduced from 82 per cent year-on-year growth to about 8 per cent growth in 2014. This growth was initially driven by less sexy products like feature phones for China Mobile, DSL routers and 3G/LTE dongles.

In fact if we go back further to 2007, feature phones drove a 757 per cent growth in consumer devices shipped.
2010 is quite crucial, Huawei Consumer Devices suffered a 32 drop in year-on-year growth in revenue / device going from $56 per device in 2009 to $38 in 2010. The margins per device then began to climb again during period from 2010 – 2014.
January’s numbers discussed at CES don’t give us the total numbers of devices shipped by Huawei, but only smartphone numbers, so I haven’t calculated revenues for 2015, but they would represent a significant upswing from the 20+% growth enjoyed in previous years.
Reading the Huawei coverage one would believe that the growth is being driven by developed markets and premium devices, but the truth according to the numbers found seem to be less clear. In between the years 2014 and 2015, the percentage revenue derived from Western Europe dropped from 11.3% to 10%, even as overall revenues grew. Much of this is driven by Southern European markets that had been hit hardest during the 2008 recession. It will be interesting to see how Huawei looks to crack Germany, the UK, France and the US.
So what does this all mean?
Huawei smartphones and watches are firstly just the most visible aspect of the company and not likely even the most profitable. Huawei equipment likely runs at least part of the internet network that brought you this page. They power mobile networks around the world (outside the US). They provide storage (very large boxes of hard disks) to banks and businesses around the world.
Huawei Consumer Device numbers are reflective of wider technological change. In the space of the nine years that I looked, you could see the peak of the feature phone business, where Huawei was predominantly a domestic supplier. The rise of the mobile dongle to fill the gaps in free wi-fi networks and the rise of the smartphone/phablet which negated some of the mobile working laptops did around email, but also acted as tethered modems reducing the need of dongles.
Huawei’s numbers are indicative of a successful fast follower strategy. Huawei learned the smartphone trade by first of all making badge engineered Android phones for T-Mobile. It then went out on its own. Each generation of phone improved in terms of industrial design and they built a direct to consumer channel over time.
Xiaomi’s direct-to-consumer e-commerce strategy was transformative in the Chinese market and something that Huawei replicated with the Honor brand. Huawei hasn’t tried to build services in the same way that Xiaomi has and hasn’t ventured as deeply into the smart home.
In terms of device numbers the company has successfully managed to displace both Samsung and Xiaomi in markets, but despite the ‘premium positioning’ it has taken a while to build the average revenue per device (ARPD). If the 20 billion dollar annual revenue announced at CES, only represents smartphone devices, then the ARPD (of $188) is still less than a third of what Apple enjoys with the iPhone.
The smartphone market like dongles and DSL modems before it is moving rapidly towards maturity and lower growth. It will be interesting to see where Huawei’s business strategy goes next.
How I got the data?
The data quoted is based on numbers given out in Huawei’s annual reports from 2006 – 2014 and the Huawei Consumer Device press room where Consumer Device started to break out some of their own numbers. The types of numbers talked about vary from year to year. You can see a copy of my collated and calculated numbers here. When converting CNY to US dollars, I assumed an exchange rate of 1 yuan is 15 cents.
More information
Huawei annual report page
Huawei Ships 108 Million Smartphones in 2015, Contributing to Annual Revenue Exceeding $20 Billion USD
Total order value of Huawei Consumer in Western Europe exceeds 2 billion dollars
Huawei Consumer Business Group Announces 1H 2015 Financial Performance
Huawei Consumer Business Group Announces 2014 Financial Performance
Huawei Consumer Business Group Announces Q3 2014 Financial Results
Huawei Consumer Business Group Announces 1H 2014 Business Performance
Huawei Consumer Business Group Ranked Third in Global Smartphone Shipments in 2013