2 minutes estimated reading time
Over time, I pulled together online ad and tech data points. It happened because I have had to compile data and visualise it based on desk and primary research. I thought that these slides may be of use to other people. So I have compiled them here. As I have time, I will try to update them with new data.
There are here as JPGs and as a presentation on SlideShare which I have linked to at the bottom of the presentation.
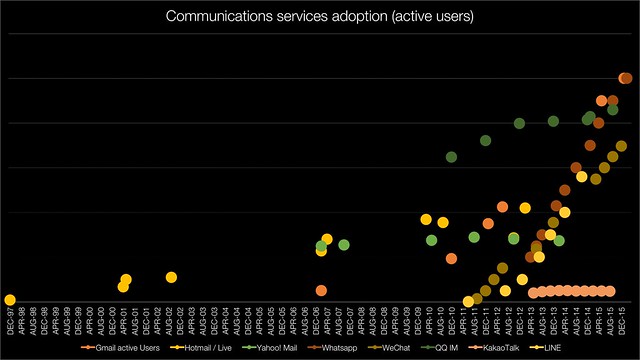
I decided to take a macro view looking at major email and OTT messaging platforms using monthly active users as a measure of adoption. This took a long slog of time to do as I had to go back and trawl quoted MAU (monthly active user) numbers from the dawn of the internet for people like Hotmail and Yahoo!. The numbers came from a wide range of sources.
What’s interesting in this graph is how the internet dot.com time felt like a rocket ship, yet saw a gentle rise in user numbers in comparison to later smartphone based services like WhatsApp, WeChat et al. Google didn’t manage to cash in as big despite owning Android, but instead acted as a spring board for new players.
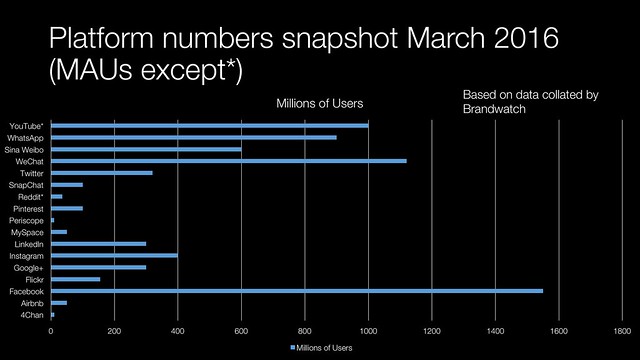
Brandwatch had a set of snapshot numbers that are rather different to the ones I had from my research
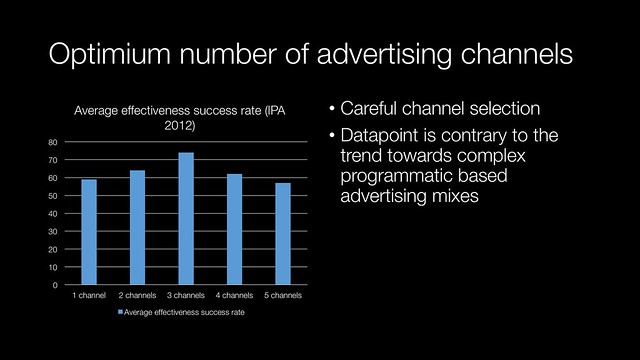
The IPA Databank is an amazing source of quality planning information and work around the optimum number of channels in advertising campaign. The data is in sharp contrast to the 300+ channels that Machine Zone’s CMO Gabe Leydon claims that they work with to have an optimal communications mix.
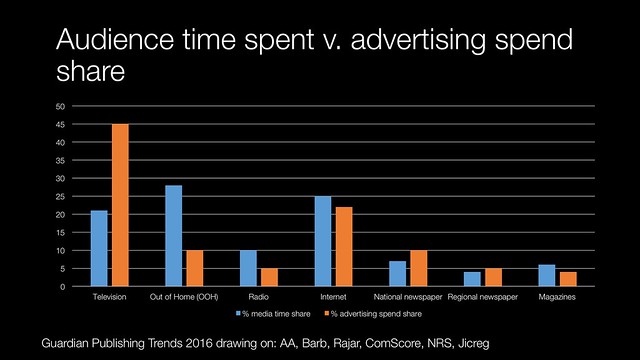
My former boss Salim Mitha used to constantly go on about how online was underspent in comparison to the amount of consumer attention that it received. More up to date data shows that its channels like OOH (out of home) and radio which are currently underspend with online rapidly coming to parity between time spent and percentage of advertising budget spent.
Of course audience spend does not take into account the context under which the audience experiences the brand.
I also have additional information on the health of the media industry and adoption of wearables in the statistics attached. More on consumer behaviour here.


