1 minutes estimated reading time
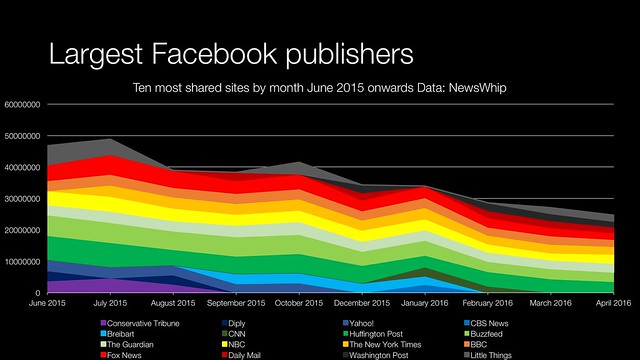
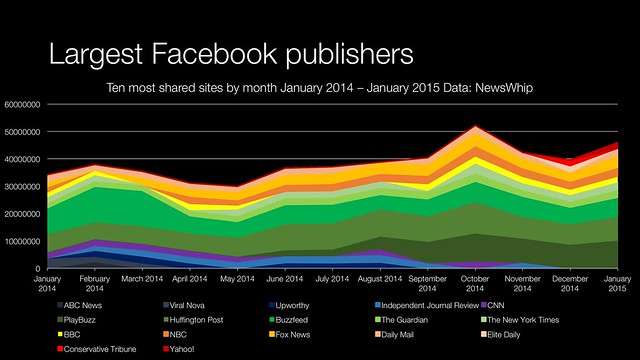
I managed to get hold of some data about the top 10 of Facebook most shared sites and it made some interesting graphs. From a media perspective Facebook has become less social.
What does Facebook most shared content tell us?
For the past year or so there has been a steady sustained decline in the amount of content shared. This even has a name internally at Facebook – context collapse.

This is even more striking when I compared it with 12 months of data from January 2014 to January 2015. One can see that the trend of the graph has gone from a positive to a negative slope. Secondly, different media organisations have sailed in and out of this chart showing that even now after years of experience they don’t a consistent formula for success.
The media landscape also started to change to more reactionary content with the rise of titles like the Conservative Tribune and Breitbart.
What these graphs don’t explain that well is why the drop in sharing happened. Did our media consumption become much more fragmented?

These trend lines partly explain media’s push into other channels like SnapChat, especially given that Twitter has hit a natural ceiling in its subscriber base.
Perilous pivot to video
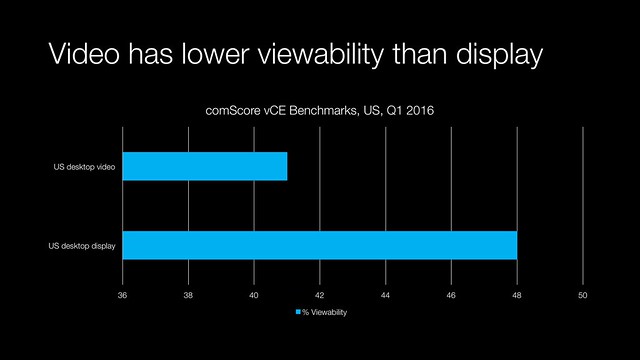
Secondly there has been a big push into video content, particularly live video content. Video is more expensive to produce, yet monetisation is difficult. Viewability of video ads is lower than display ads. One has to wonder about the sustainability of all this video production? Especially since many of these media organisations don’t seem to have managed long term success at the top of Facebook’s eco-system.

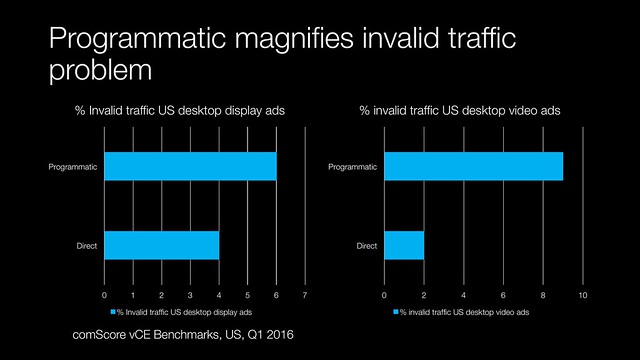
Ad fraud or ‘invalid traffic’ is higher on video advertising inventory solid via programmatic platforms – which are the hot new thing. Both of which are issues of concern to marketers and publishers alike.

More on Facebook related topics here.
Comments
One response to “Facebook most shared”